

Solar

Every panel, every module, every cycle.

PV modules, combiner boxes and inverters inspected thermally at plant scale, so faults are found, classified and ranked before they cost yield.

Every service, laid out in full.

01 Digital Twin, Anomaly Detection & Inspection Checklists

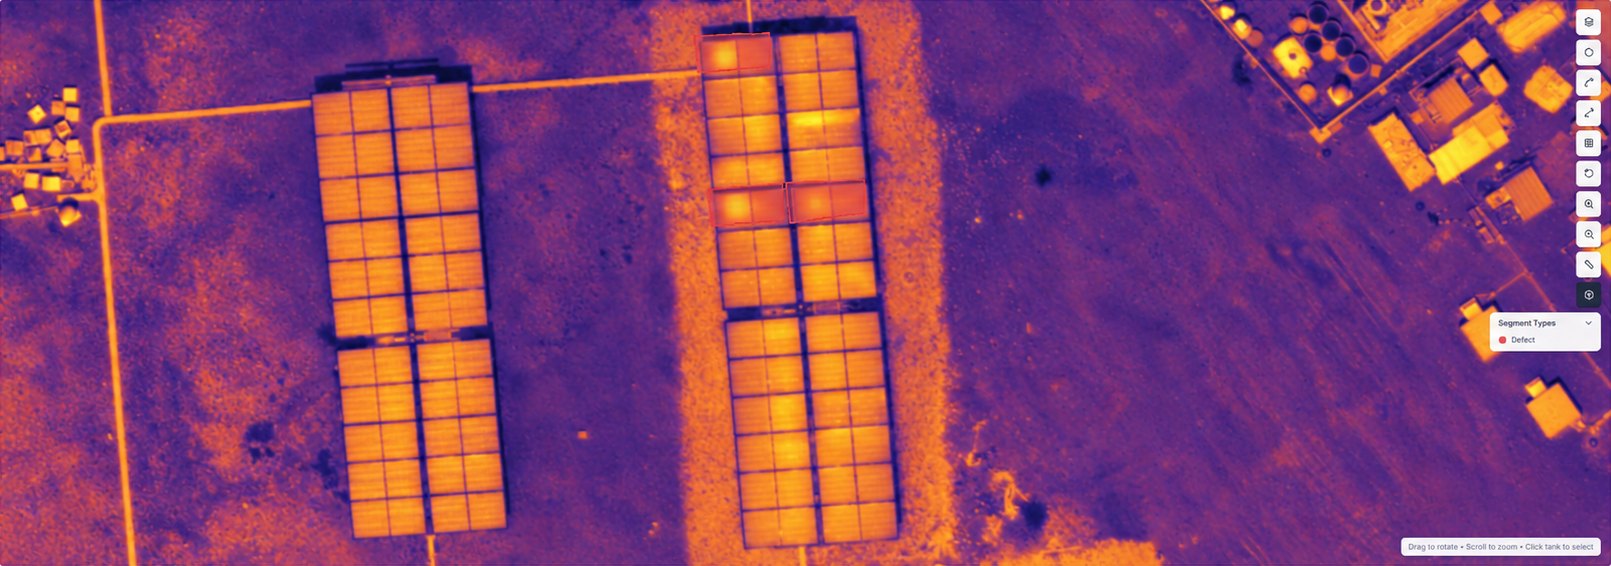
A persistent model of the plant, module by module, with thermal anomalies flagged and located to table, row and string every cycle.
Asset types covered.PV modules, strings, combiner boxes, inverters, trackers.
Detects on every pass.Hotspots, cell defects, bypass diode failures, disconnected strings, soiling patterns.
Inspection checklists.Findings are logged to an inspection checklist per block, each with its thermal and visual image.
Every cycle compared.Every flight is compared with the last, so new hotspots and worsening faults are flagged.
Assets and detections
PV ModulesStringsCombiner BoxesInvertersTrackersHotspotsCell DefectsDiode FailuresDisconnected StringsSoiling Patterns
Thermal crop of a PV table with hotspots marked
02 Plant-Wide Thermography

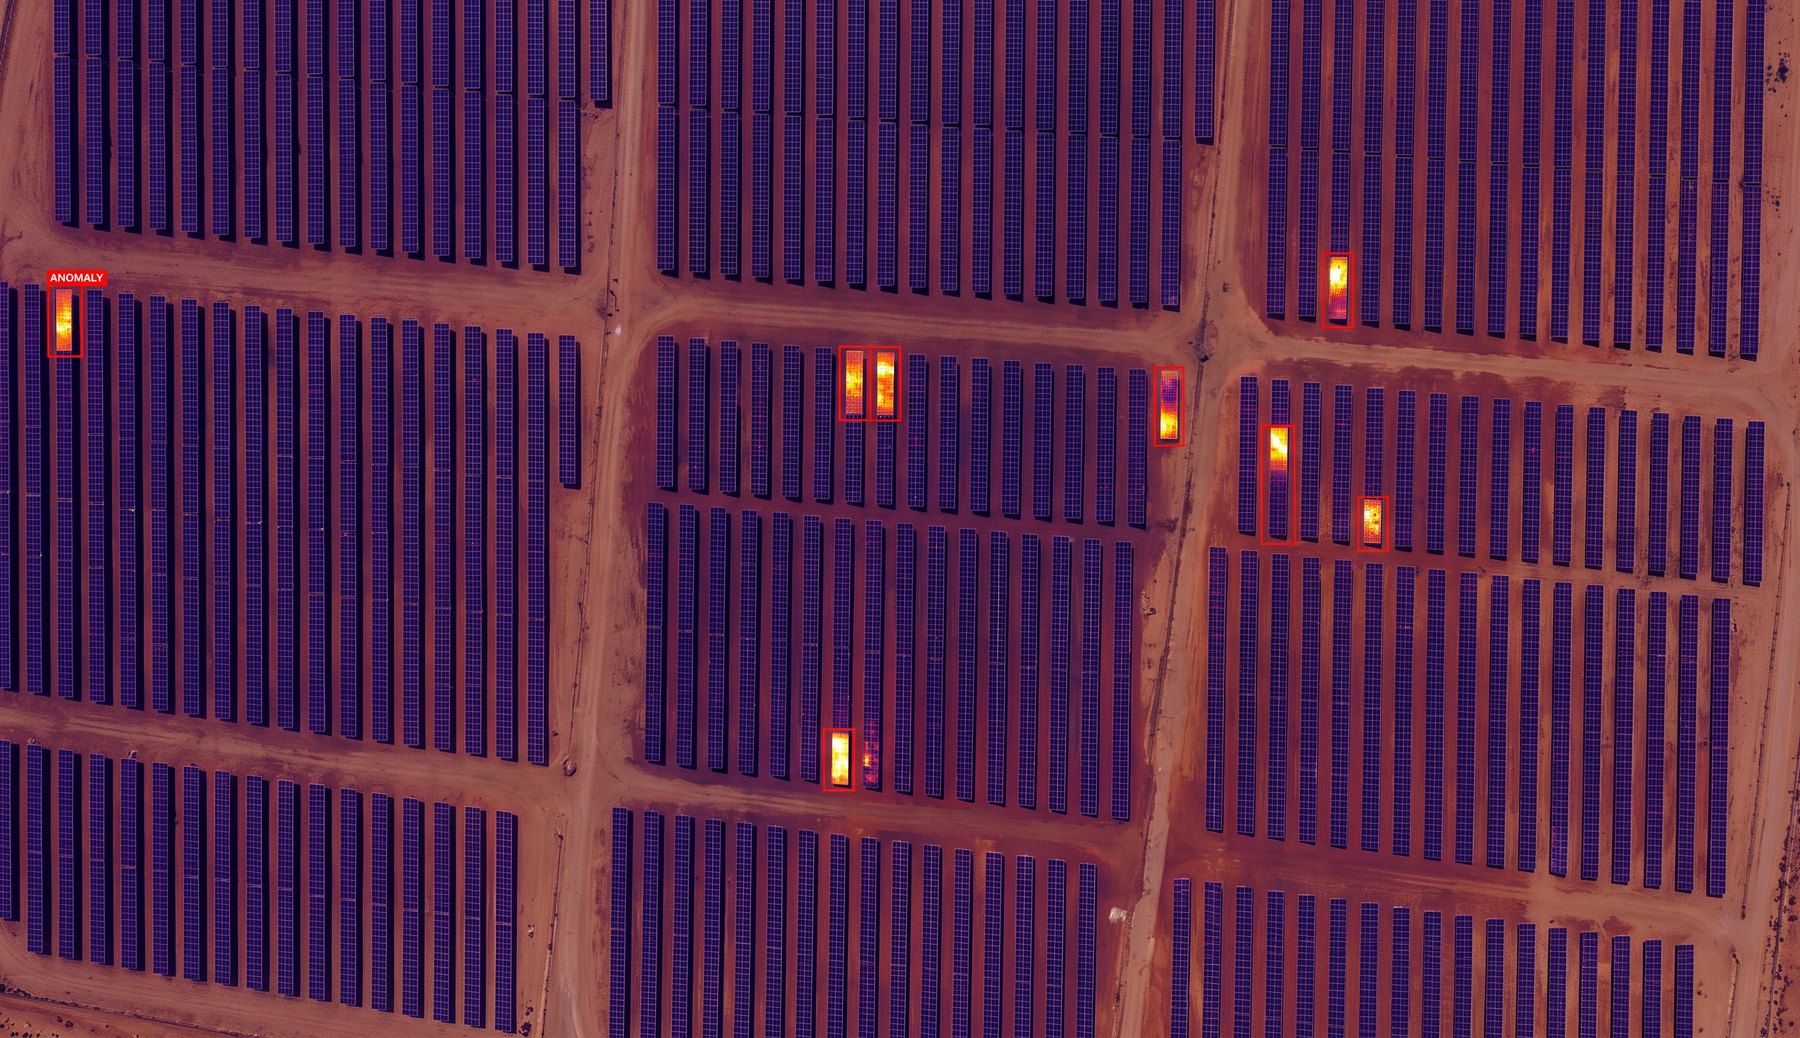
Radiometric thermal capture of the full array, with every image georeferenced to table, row and string.
Full coverage.Every module captured and not a sample extrapolated across the field, planned to the ground sample distance your scope requires.
Georeferenced findings.Each anomaly located on the plant layout, down to the module where resolution allows.
Valid capture conditions.Flights planned for the irradiance and weather windows in which thermal findings are reliable.
Plant-scale thermal map.A thermal orthomosaic of the plant for review, comparison and handover.
Assets and detections
Thermal OrthomosaicRadiometricBy Table / Row / String
Thermal orthomosaic of a PV block with anomalies marked
03 Module Fault Classification & Severity Ranking

Each anomaly is classified by type and ranked by temperature rise, so O&M gets a prioritized worklist and not a folder of thermal images.
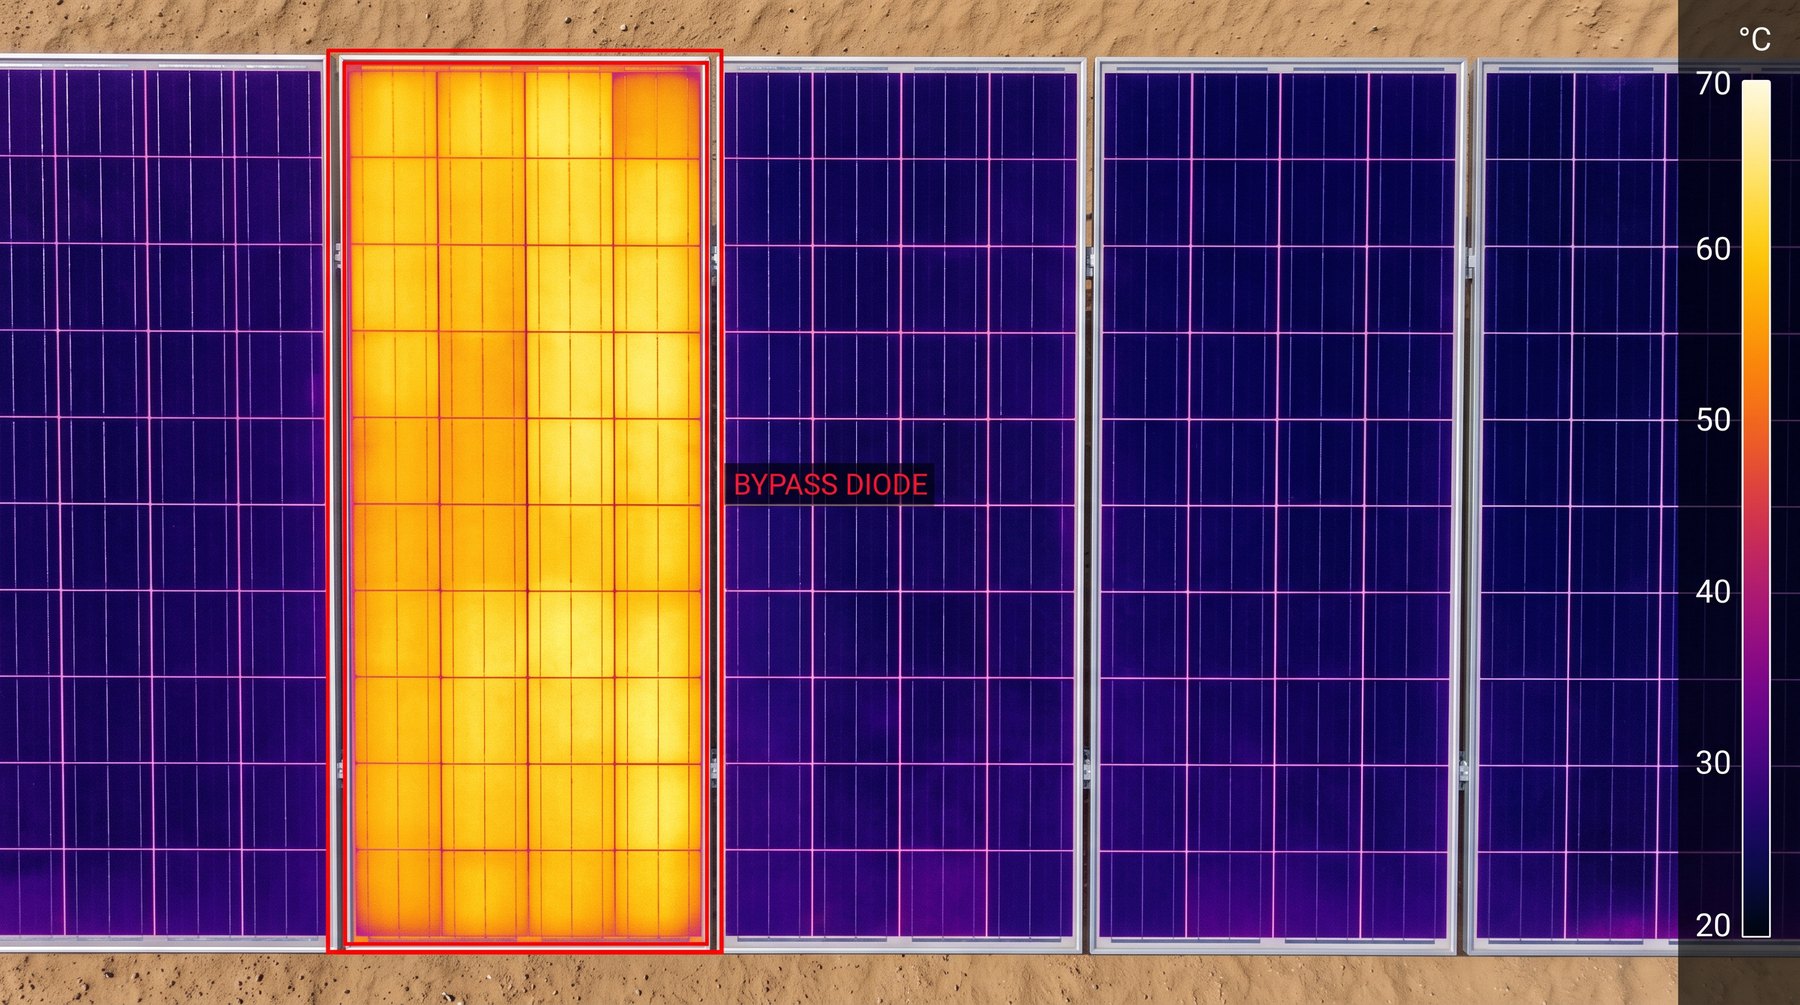
Fault classes.Single-cell and multi-cell hotspots, bypass diode failures, open-circuit modules, cracked-cell patterns where thermally visible, and PID-like patterns.
Severity ranking.Findings ranked by temperature rise so the worst faults come first.
Worklist by location.Grouped by block and table, exportable as CSV and PDF for O&M dispatch.
Evidence per finding.Thermal and visual image attached to every anomaly.
Assets and detections
Single-Cell HotspotMulti-Cell HotspotBypass DiodeOpen-Circuit ModuleCell CrackingPID Pattern
Thermal crop of a bypass diode substring pattern
04 Balance-of-System Thermal Screening

The electrical equipment around the modules, scanned in the same flight: connectors, combiner boxes, inverters and trackers.
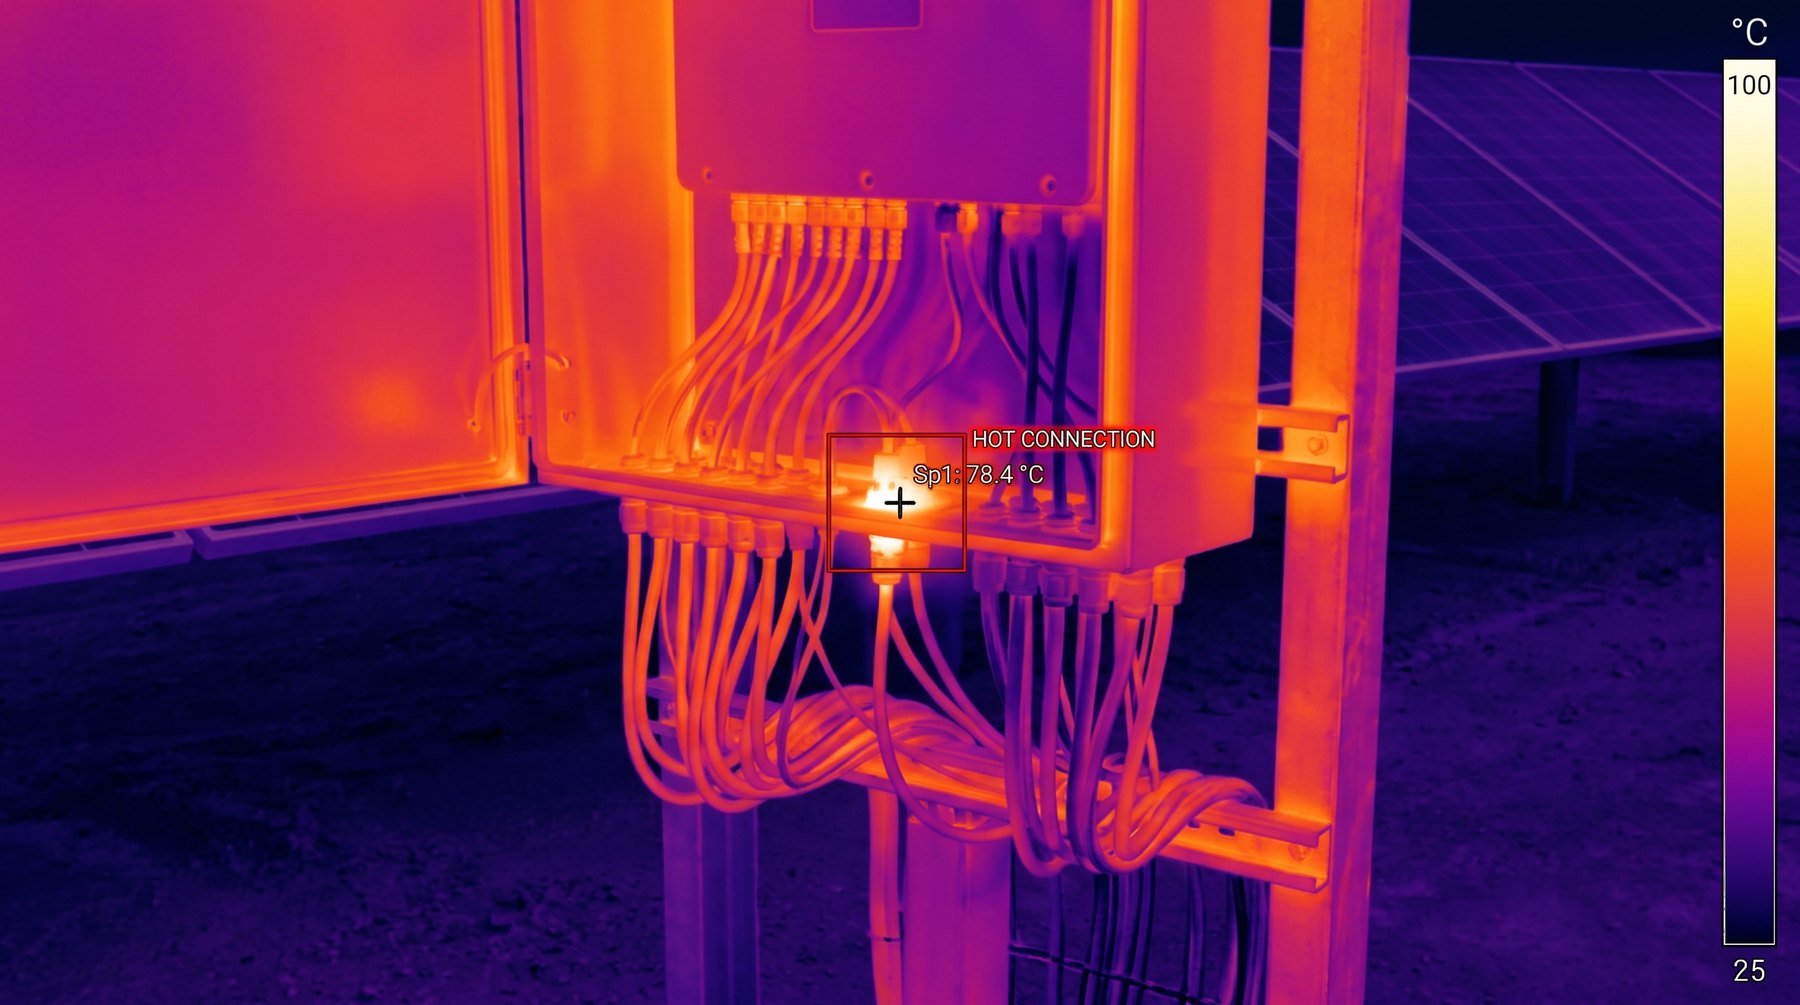
Connectors and junctions.Hot connectors and junction boxes located across the array.
Combiner boxes and inverters.Thermal anomalies on combiner boxes, inverters and transformers recorded per asset.
Trackers.Tracker motors and cabling checked for abnormal heating.
String-level patterns.Disconnected or underperforming strings identified from the thermal pattern across a string. Yield impact estimates are added where inverter or SCADA data is shared.
Assets and detections
ConnectorsCombiner BoxesInvertersTransformersTracker MotorsDisconnected Strings
Thermal image of a combiner box with a hot connection
Included on every inspect deployment
Evidence-linked findingsPDF and CSV reportsThreshold alertsFull audit trail

Built from the ground up by FalconViz. inspect is open to customization. If you need a detection that is not listed here, we can build it around your assets and your standards. Discuss a custom detection →

Would you like to discuss solar panel inspection project?

Book a Demo